Inspector
The inspector is Dockyard's local test + debug surface (RFC §12). It is:
- Dev-mode-gated, localhost-only, operator-initiated only. Never a production client; never reachable off-localhost (P4 in §1). "Operator- initiated only" — re-cast from the older "read-only" framing in D-144 — means every client-shaped operation is driven by an explicit operator UI action (a button click), runs in a short-lived per-request MCP client session, and has a documented decision entry (D-099 / D-103 / D-131 / D-134) explaining why it stays within P4.
- A pure Logbook consumer. It reads no runtime internals — every signal it shows is an emitted Logbook event (P2).
- Wired to your project. Verdicts re-run
dockyard validate; the Fixtures switcher derives from the project's generated tool contracts; the App preview reads the running server'sui://resources via short-lived MCP client sessions, scoped to operator- initiated UI actions (decisions D-103, D-130, D-144).
Attach
The fastest path is dockyard dev — it auto-attaches the inspector as a third supervised child alongside the Go server and Vite, and prints the inspector URL to stdout:
dockyard dev
# ...
# INFO inspector ready at http://127.0.0.1:54321
cmd-click the URL to open it. Pass --no-inspector (CI / headless) to skip the supervised inspector child. See the dev loop guide for the auto-attach details.
For a server that is not under dockyard dev — a remote loopback build, a deployed dev server you are debugging — use the standalone path. In one terminal, run the server on HTTP (the inspector relays via HTTP):
DOCKYARD_TRANSPORT=http dockyard runIn a second terminal, attach the inspector:
dockyard inspect --url http://127.0.0.1:8080 --dir path/to/project| Flag | What |
|---|---|
--url | the running MCP server's base URL; required to attach |
--dir | the project directory; powers Verdicts + Fixtures |
--port | the inspector's loopback port (default: OS-assigned) |
--no-open | don't open a browser — CI / headless use |
A non-loopback --port host is refused before the listener opens (the CVE-2025-49596 lesson).
Rail tabs
| Tab | What it shows / does |
|---|---|
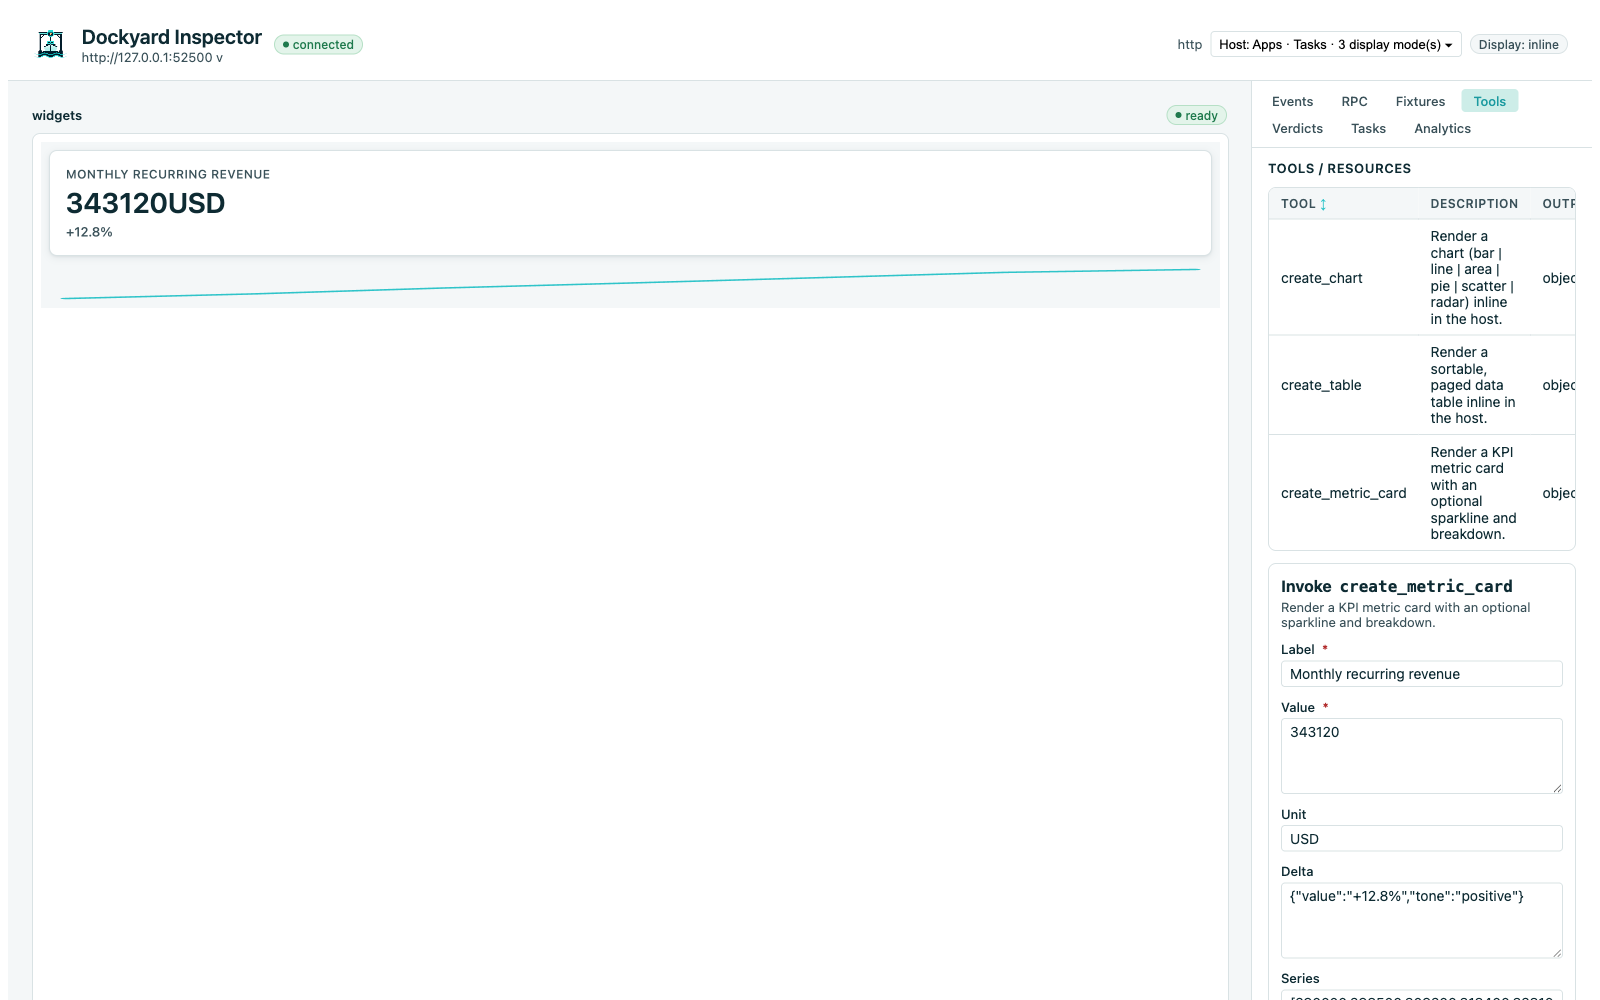
| Tools | All registered tools; fire one (the Operator-Invoke surface, D-131) |
| Prompts | All registered MCP prompts; fill arguments and render prompts/get messages (D-163) |
| Apps | Each ui:// resource rendered in a sandboxed iframe |
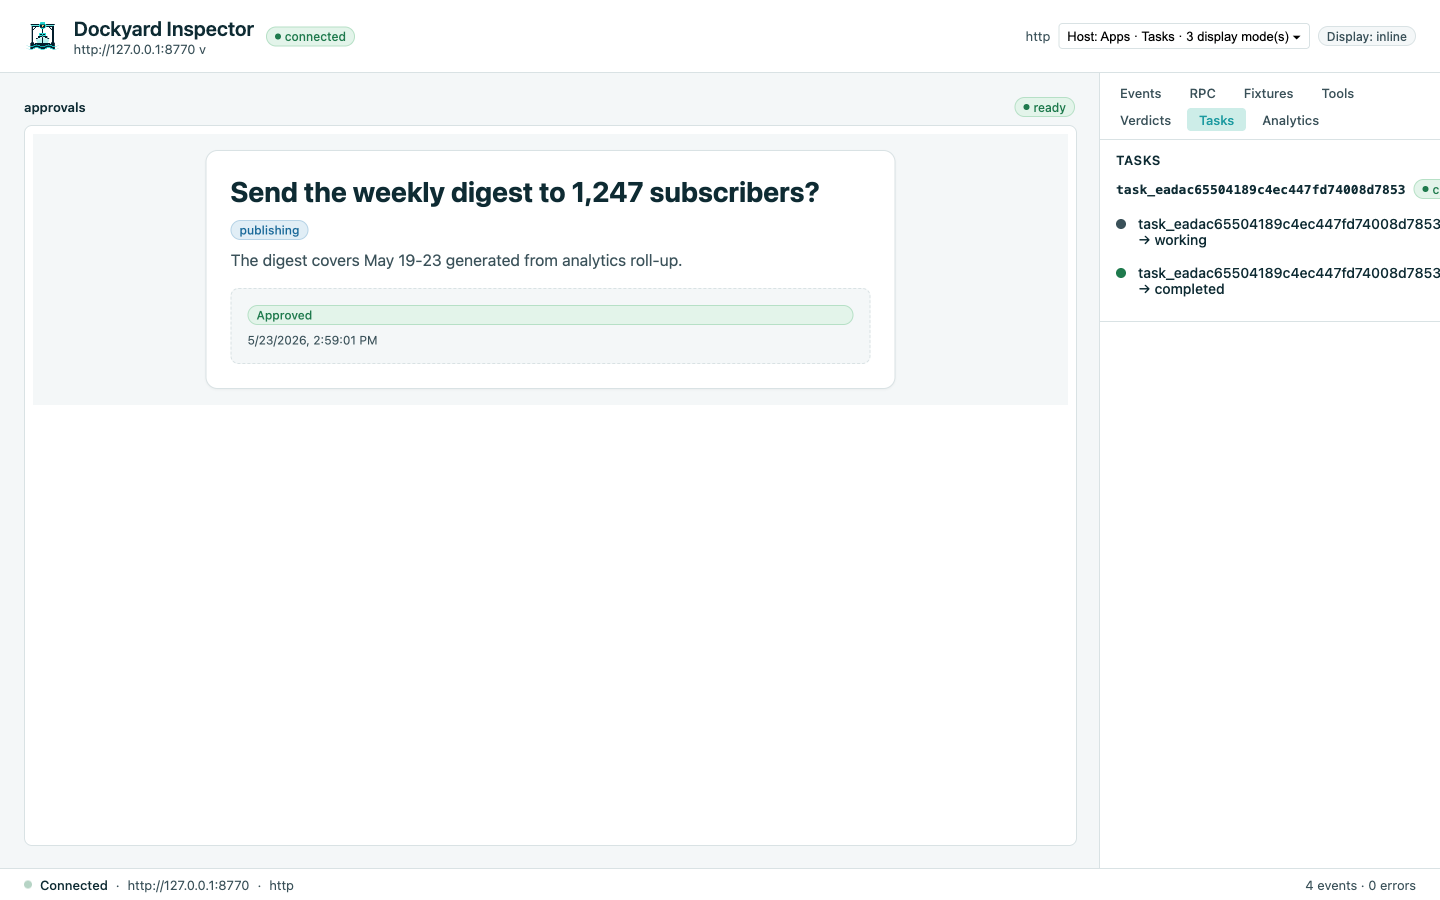
| Tasks | Active + recent tasks rendered as a lifecycle Timeline |
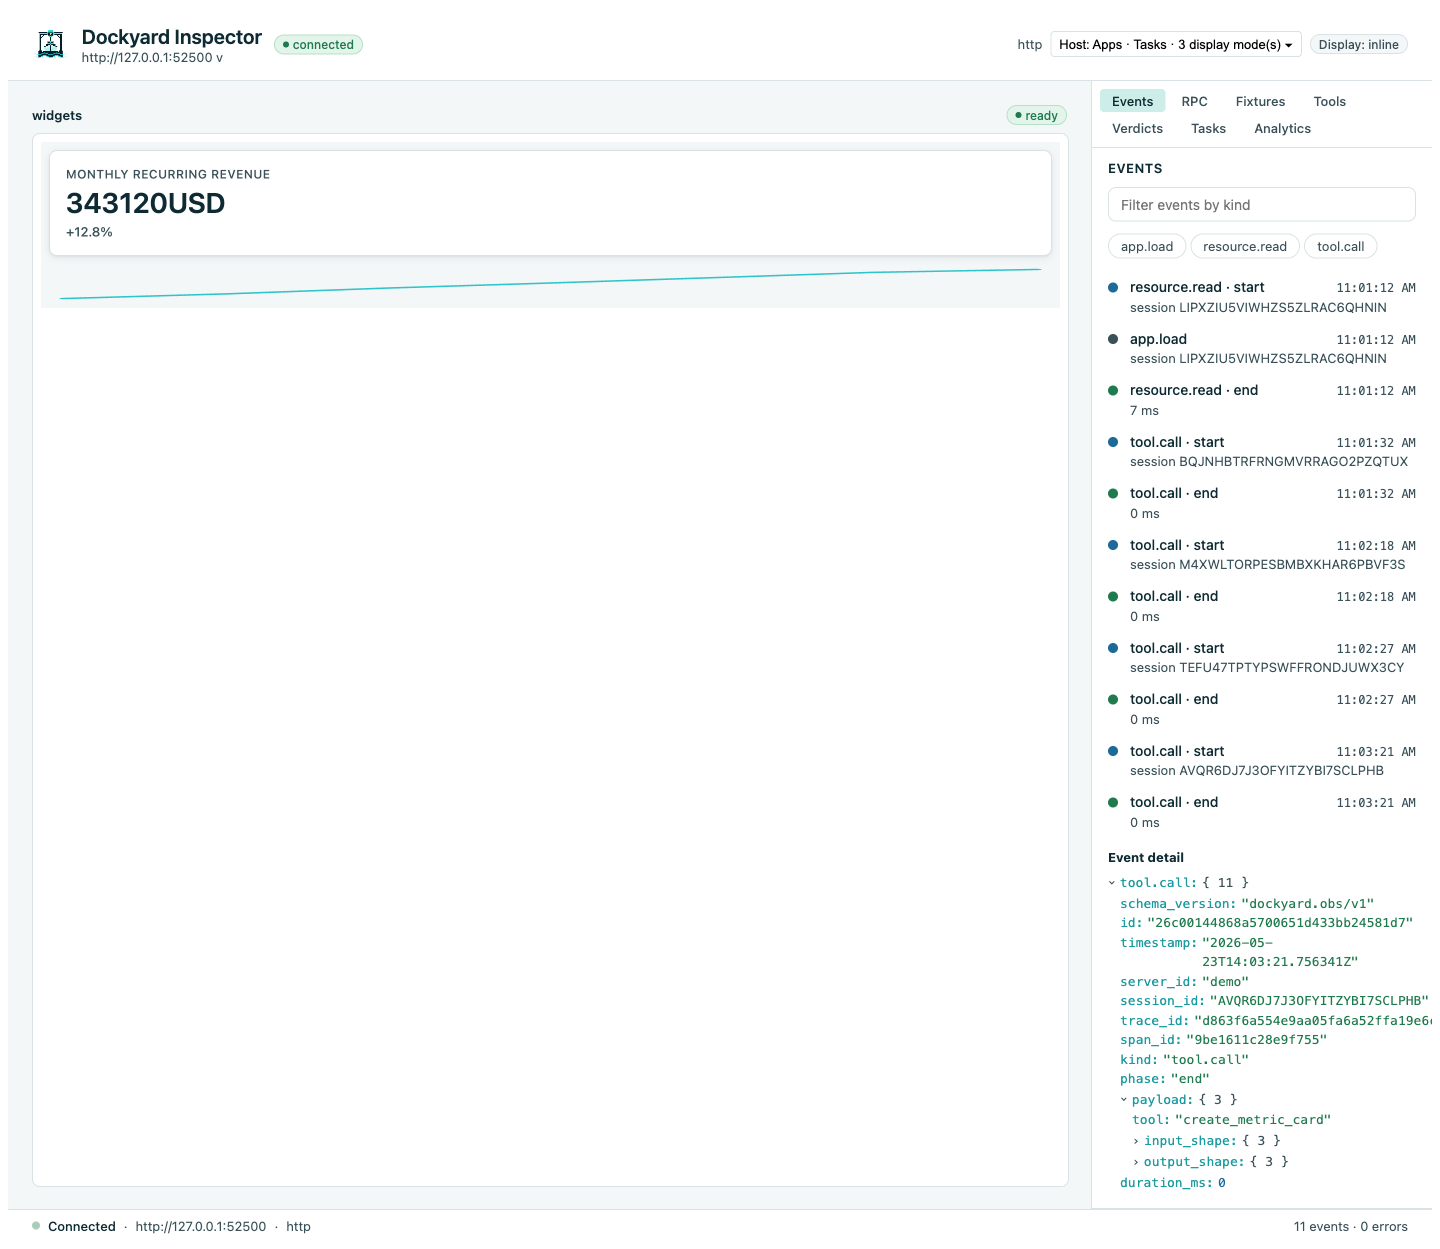
| Events | The live Logbook stream |
| Analytics | Per-tool latency + counts |
| Fixtures | Pick a UI state for the App preview |
| Verdicts | Re-runs dockyard validate |
| RPC | Raw JSON-RPC log |
The Apps preview is a faithful host: it validates your App's ui/initialize handshake against the MCP Apps schema (rejecting a non-spec shape instead of silently accepting it) and sizes the preview iframe to the App's reported content height — so a handshake or rendering problem surfaces here, not only in a real host. If an App renders blank, see the blank-App troubleshooting.
The Prompts panel
MCP separates two model-facing primitives. Tools are things the model PUSHES (a typed input becomes a typed output). Prompts are templates the host PULLS via prompts/get (named curated message sets a chat host surfaces as /slash commands; the user picks one, the host fills its arguments, the model is seeded). The Prompts panel lists every prompt the attached server registered via runtime/server.AddPrompt. Pick one, fill its string arguments (MCP prompt arguments are flat strings — see D-152; no JSON Schema form), press Invoke prompts/get. The inspector opens a short-lived MCP client session, calls prompts/get, closes the session, and renders the resulting message list.
The panel's invocation surface uses the same operator-initiated P4 framing as the Tools tab (D-131, D-144) — the inspector remains the lone client-shaped component, dev-mode-gated, localhost-bound. The new endpoint is POST /api/prompts/get.
Try it against examples/prompts-demo — three prompts (summarize_for_review, code_review, explain_error) exercise the panel end-to-end.
The Fixtures switcher
Each tool ships six default fixtures (D-130):
| Fixture | Drives |
|---|---|
happy | ready state with realistic synthetic payload |
empty | empty arrays / nil branches |
error | handler-returned error path |
permission | permission-denied stub |
slow | deliberately delayed response |
large | stress-sized payload |
On-disk project fixtures (<dir>/fixtures/<tool>/<kind>.json) override the schema-derived synthetic ones.
![]()
Capability emulation
Flip Apps, Tasks, the logging capability on/off to verify your server degrades gracefully on a host that hasn't negotiated that capability (RFC §7.5, the capability-driven rule from AGENTS.md §6).
Task lifecycle
For task-augmented tools, the Tasks tab renders the lifecycle as a Timeline (created → working → input_required → working → completed):
Why this is different
mcp-use's inspector is interactive but not a test harness (brief 04 §2.5): no fixture system, no scripted state-switch, no contract drift catcher, no host-compatibility matrix. Dockyard's inspector is wired to the project — the same checks dockyard validate runs, the same fixtures dockyard test exercises, the same Logbook stream the runtime emits. The inspector is the interactive face of the same quality gates.